دورات Power BI (بور بي اي) و Excel (إكسل) تدريب خاص فردي وجماعي نظام كوتشنغ أقوم بتدريبك على بيناتك الخاصة منها تدرب و منها تعمل شغلك ادربك بلغة المكاتب و الأعمال و ليس لغة المعاهد . أشارك معاك خبرة 20 سنة
هل تواجه صعوبة في تنظيم بياناتك أو بناء تقارير احترافية؟

لماذا هاني أناليتكس؟
- خبرة 20 عاماً: ممارسة عملية في كبرى الشركات العالمية مثل سامسونج.
- سجل تدريبي حافل: صقل كوادر في وزارة الصحة، جاهز، إمكان، ومصدر.
- منهج عملي: نركز على ما تحتاجه فعلياً لإنجاز عملك بعيداً عن التعقيد الأكاديمي.
- حلول متكاملة: تدريب مخصص للأفراد والمنظمات لتمكين الفرق وتحليل البيانات.
- تدرب وأعمل شغلك في نفس الوقت على بياناتك.
- عينات بينات مختلفة مع إرسال الملفات بعد إنتهاء الدورة مرجع لك.
- إستشارات مجانية بعد إنتهاء الدورة لمدة 3 شهور.
خدمات هاني أناليتكس
التدريب الفردي
"تدريب شخصي مكثف يركز على احتياجاتك المهنية الخاصة."
التدريب الجماعي
تدريب الفرق والشركات (Corporate)
استشارات المشاريع
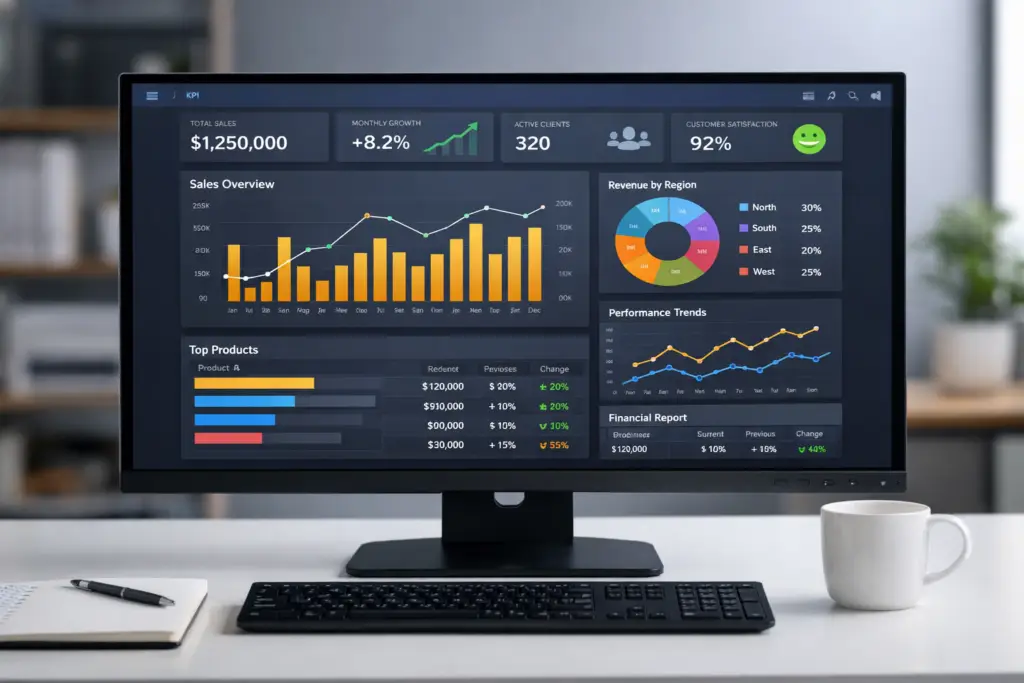
"بناء وتطوير أنظمة Dashboards ذكية لمشروعك ."
- دورة Power BI (فردي).
- دورة Excel (فردي).
- إعداد التقارير والتحليلات الخاصة.
- ورش عمل Power BI للمنظمات.
- تدريب Excel للمحاسبين والمحللين.
- استشارات لرفع جودة البيانات الداخلية
- بناء Dashboards بـ Power BI.
- أتمتة التقارير بـ Excel و Power Query.
- تنفيذ مشاريع بيانات ضخمة ومعقدة.
ماذا ستتعلم في دورة Power BI ؟
- معالجة وتنظيف البيانات (Data Cleaning)
- إستخراج الأنماط (Data mining)
- تحليل البينات (مستوى الأول - مستوى الثاني - المستوى الثالث)
- الربط و الإتصال مع البيانات بإستخدام Power BI
- العلاقات بين البيانات (Data Modeling)
- إنشاء الرسوم البيانية بإستخدام Power BI
- التصور و إنشاء التقارير بإستخدام Power BI
- النشر و المشاركة بإستخدام Power BI